SF Price Appreciation By Neighborhood
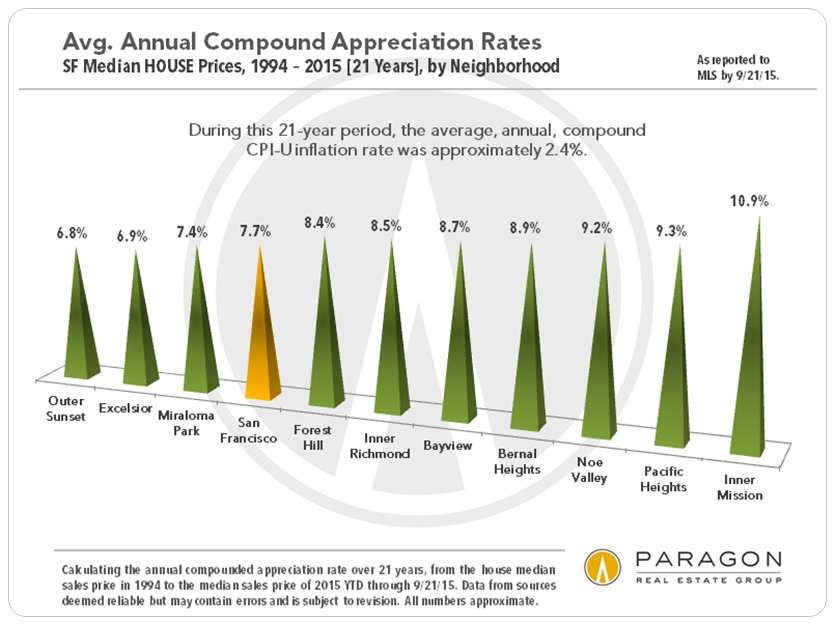
The following shows the annual, compound, median-sales-price appreciation rate for San Francisco houses, by neighborhood, since 1994.
This calculation simply uses the 1994 median sales price and calculates appreciation through to the 2015 YTD median sales price. (Return on cash investment percentages are higher, since that calculation starts with a 20%-of-median-price downpayment.)
The analysis is for houses (SFDs) because house inventory has barely changed since 1994, thus it’s a pretty decent apples to apples comparison (even though a lot of renovation work has taken place since then). Condo prices have been greatly impacted by tens of thousands of new construction condos in the past 21 years, which would skew the calculation.
The calculation was performed for those sub-districts which I felt had enough house sales in both 1994 and 2015 YTD to be statistically reliable (more or less).
Tags: buying san francisco real estate Christopher Stafford and Terry Wright Prices of San Francisco real estate San Francisco luxury real estate San Francisco price appreciation
Categories: Uncategorized
Leave a comment