Uncategorized

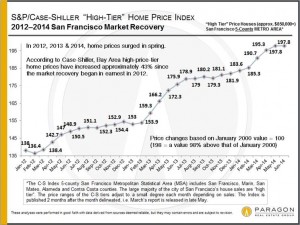
“High-Tier” Home Price Index

Nationally, the Case-Shiller Index ticked down a tiny bit in November, but the SF Metro Area ticked up a tiny bit. Probably neither change is statistically relevant and we should simply say, according to C-S, that Bay Area prices remained flat month over month, and indeed have remained basically flat since the end of the […]

San Francisco New Construction Coming!

We boiled down the brand new 36-page SF Planning Dept. Pipeline Report – for both residential and commercial projects – into a “Highlights” report, and the PDF is attached. The bullet points are worth a browse. This first chart is straight from the city’s report. Almost 7000 residential units are currently under construction – including […]

New Case-Shiller: Bay Area Home Prices Tick Up a Little

After the feverish spring 2014 market, home prices in the high-price tier – which applies best to San Francisco and Marin counties – flattened and then ticked down a little, while more affordable home segments continued to tick up: It’s not unusual for the market to cool off and plateau during the summer months. The […]

How Does San Francisco Spend Their Money?

The New York Times had an interesting analysis of how people spend money on discretionary or status items in different metro areas as compared to the national average. I thought it would be fun to pull out the Bay Area metro data:

We Are At It Again!

This chart shows the top 6 residential brokerages in San Francisco. Paragon is the only one to increase its number of MLS transactions year over year. (For the period, Paragon and CB are basically tied for 3rd place for number of sales behind Zephyr and PU.)

This Recovery vs. Past San Francisco Recoveries

Generally speaking, these charts apply to SF, Marin and San Mateo markets – those in which “high-price-tier” houses predominate (high-price-tier is the upper third of Bay Area house sales – the median house prices in all 3 counties are well above the threshold for the high-price tier in the Bay Area).

Too Bad About Our Competition :(

Two market share charts, the data is straight from Broker Metrics for SFD, condo, co-op, TIC and 2-4 unit sales. It was a very tough summer for most of our competition. 🙁 Dollar Volume Home Sales, summer 2014 vs. summer 2013. Total dollar volume sales in SF over the summer were up about 1% year […]

Case-Shiller Index for the San Francisco Metro Area

The Case-Shiller Index for the San Francisco Metro Area covers the house markets of 5 Bay Area counties, divided into 3 price tiers, each constituting one third of unit sales. Most of the San Francisco’s, Marin’s and San Mateo’s house sales are in the “high price tier”, so that is where we focus most of […]

Tenants in Common in San Francisco

All the issues pertaining to TIC formation, condo conversion, Ellis Act restrictions, tenant eviction restrictions, relocation fees, financing, etc. seem to be taking a toll on the TIC market as far as quantity of sales. Note that the 2014 figure on the chart is a projection for total 2014 sales volume based on YTD sales. […]

Seasonality & the SF Real Estate Market in PDF form

The issue of seasonality often comes up (with Sellers in particular) and so here are 5 charts (click the link to the PDF below) looking at new listings, overall inventory available to purchase, listings accepting offers, median prices and the luxury home segment – in the context of seasons. It’s useful to realize that the […]

© 2023 Real Estate Advisors.